State Lotteries Shift From Paper Stubs to Mobile Apps Reshaping Who Joins the Draws
State-run raffles began with paper tickets sold at corner stores and community events, where participants wrote names on stubs and waited for manual draws at local halls. Data from the North American Association of State and Provincial Lotteries shows these systems operated across dozens of jurisdictions by the mid-20th century, relying on printed records and physical security measures to track sales and winners.
Early lotteries drew participants mainly from nearby neighborhoods because distribution depended on physical outlets, and many states limited sales to licensed vendors. Researchers at academic institutions tracked how these constraints kept participation steady among older adults who visited the same retail spots weekly, while younger residents encountered fewer opportunities to buy in.
Paper Systems Give Way to Early Digital Records
By the 1990s several lottery operators introduced centralized computers that printed tickets with barcodes, yet the core experience remained a paper receipt handed across a counter. Those upgrades reduced errors in record-keeping, and sales data revealed gradual increases in overall volume without major changes in who bought the tickets. Observers noted that the same demographic groups continued to dominate because access still required a physical trip during business hours.
States began testing phone-based entries in limited pilots during the early 2000s, yet widespread adoption waited for smartphones to reach most households. Figures from government statistical agencies indicate that mobile penetration crossed key thresholds around 2015 in many regions, opening the door for app-based ticket purchases that removed the need to visit a store.
App-Based Draws Expand Reach and Alter Participation Patterns
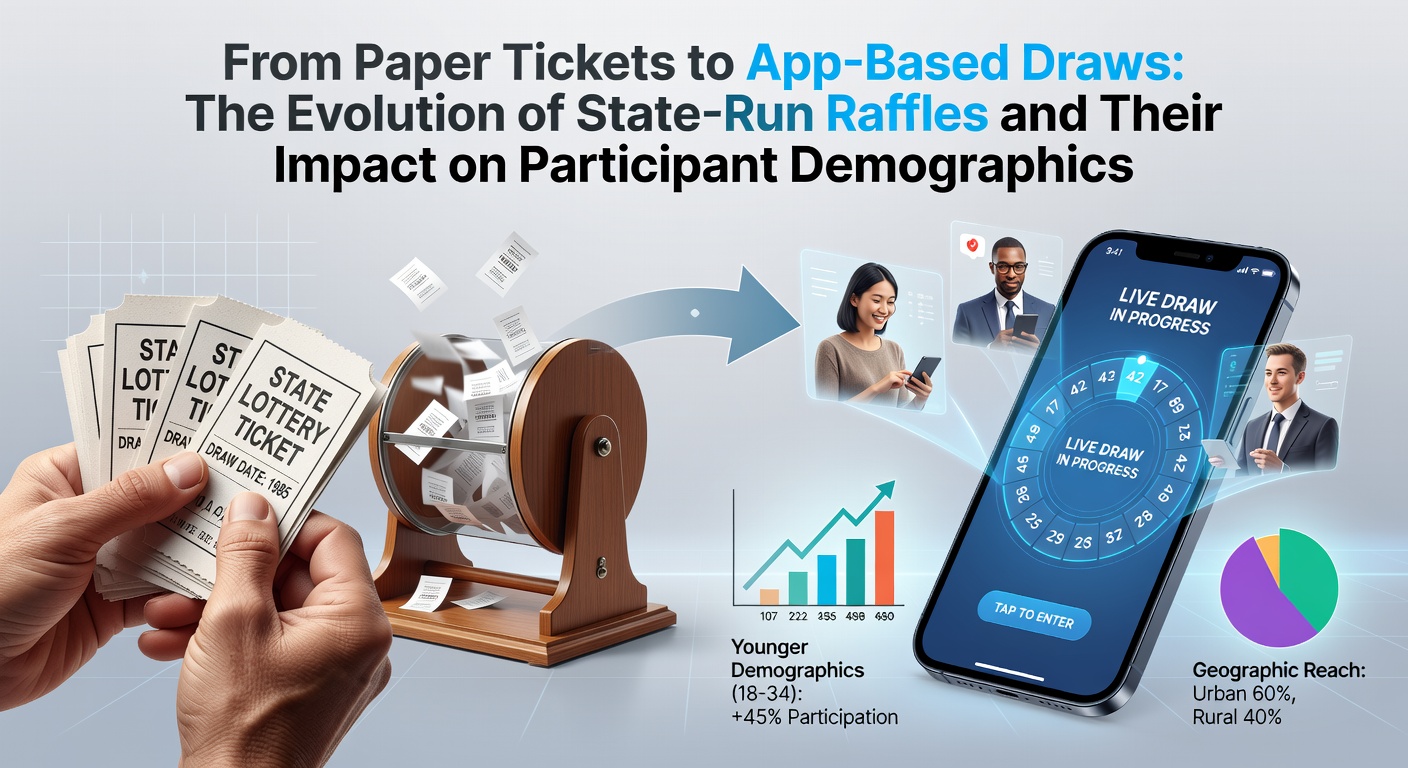
Once mobile apps handled registration, payment, and result notifications, operators recorded measurable shifts in buyer profiles. Data indicates higher participation rates among adults aged 25 to 40 who previously bought tickets only during occasional large jackpots. The same datasets show continued involvement from older groups, though their share of total sales declined slightly as younger cohorts increased volume through recurring subscriptions available inside the apps.
Geographic patterns also changed. Rural residents gained equal access once cellular coverage improved, and records from multiple state programs list rising ticket purchases from counties that had fewer retail outlets. Urban areas saw steady growth as well, particularly among commuters who completed purchases during transit rather than stopping at a shop.

Income distribution among players widened in several jurisdictions after apps launched. Previously, studies found stronger representation from middle-income households; later figures reveal increased entries from both lower and higher brackets because digital wallets lowered barriers for small, frequent purchases while subscription features appealed to those managing larger budgets. Government reports tracking household expenditure note these trends without attributing causation to any single factor.
Demographic Data Through 2026 Shows Continued Evolution
Records compiled through May 2026 illustrate ongoing adjustments in player bases. App analytics from multiple operators document rising female participation in certain age bands, while male players remain the majority in high-volume categories. Educational attainment data collected by research consortia indicate college graduates now constitute a larger portion of regular users compared with earlier paper-only eras.
Operators introduced responsible-play tools such as spending limits and cool-off periods directly inside apps, and usage logs show these features adopted across demographic segments. Analysts at independent research firms report that the tools appear most frequently among users who maintain weekly subscriptions rather than one-time purchases.
Regional Examples Highlight Varied Outcomes
Programs in North American states that launched full app platforms earlier than others provide comparative datasets. One jurisdiction recorded a 28 percent rise in unique accounts within two years of rollout, with the largest gains among residents aged 30 to 45. A separate Canadian provincial system reported similar uptake accompanied by stable overall sales from traditional retail channels, suggesting apps supplemented rather than replaced existing methods.
Australian state operators adopted comparable technology around the same period and published demographic summaries showing increased engagement from regional areas once mobile registration became available. European programs outside the United Kingdom documented parallel movements toward younger cohorts after similar digital transitions.
Conclusion
The move from paper tickets to app-based systems altered distribution channels and produced measurable differences in who participates in state-run raffles. Sales records, account data, and periodic surveys compiled by government agencies and industry associations document these shifts across age groups, locations, and income levels. Continued monitoring through 2026 and beyond will clarify whether current patterns stabilize or evolve further as additional features reach users.