Documenting Dealer Bust Clusters: The Practice of Streak Mapping in Blackjack
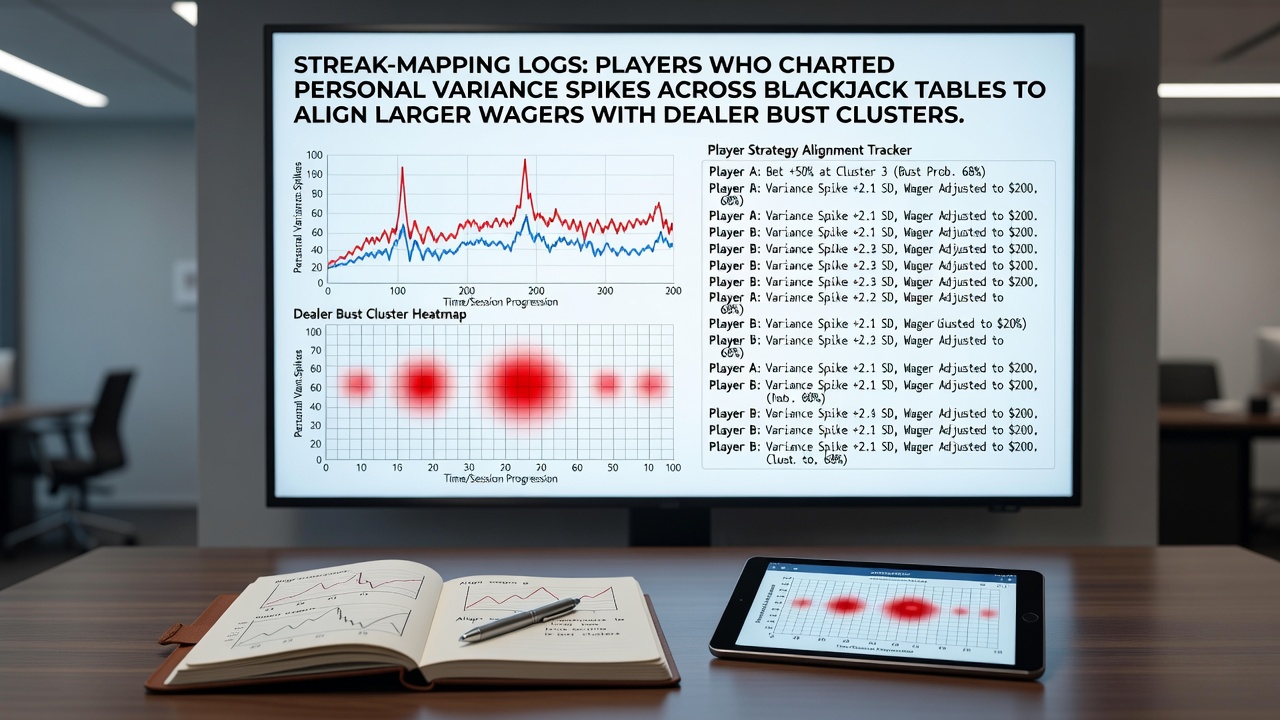
Blackjack tables generate sequences of outcomes that some players attempt to track through detailed personal logs, focusing on variance spikes where dealer bust rates deviate from expected averages. These records typically note card distributions, dealer upcards, and bust frequencies across multiple sessions, allowing participants to identify periods when larger wagers might coincide with elevated bust clusters. Data from table games shows dealer bust percentages hover near 28 percent under standard rules, yet individual sessions can produce runs that exceed or fall short of that baseline for extended periods.
Core Elements of Streak-Mapping Logs
Participants maintain notebooks or digital spreadsheets that capture specific metrics such as consecutive dealer busts, shoe penetration levels, and player hand results relative to those busts. Observers note that entries often include timestamps, table numbers, and rule variations like dealer hit or stand on soft 17, since these factors influence bust probabilities. Researchers at the University of Nevada have examined similar tracking methods in controlled settings, finding that short-term deviations occur regularly due to the finite nature of card decks in play.
Logs frequently categorize data into segments that highlight variance spikes, defined as intervals where bust rates climb above 35 percent for five or more hands in succession. Players cross-reference these segments with bankroll allocation plans, shifting from minimum bets to larger amounts only after confirming the pattern through multiple observations. This approach relies on the statistical reality that blackjack outcomes follow hypergeometric distributions rather than independent trials, creating natural clustering effects within each shoe.
Table Selection and Multi-Venue Tracking
Those who pursue streak mapping often rotate between several tables within a single casino or across properties to gather comparative data points. One documented case involved a player who recorded bust sequences at six different blackjack pits over a four-hour period, noting that certain dealers and shoe compositions produced tighter clusters of bust outcomes. Such rotation helps isolate whether observed spikes stem from random variance or from specific game conditions like continuous shuffle machines versus hand-dealt shoes.
Figures from the Nevada Gaming Control Board indicate that blackjack remains among the most tracked table games for statistical anomalies, with win percentages fluctuating between 1.5 and 2.5 percent for the house across reporting periods. Players incorporate these broader benchmarks into their logs to establish personal baselines, then adjust wager timing when local sequences diverge. Software tools that export hand histories from online platforms have also entered use, enabling remote analysis of variance patterns without physical presence at the table.

Statistical Foundations and Limitations
Blackjack mathematics rests on conditional probabilities that change with each card removed from the shoe, creating the variance that streak mappers seek to exploit. Studies published in the Journal of Gambling Studies demonstrate that dealer bust rates exhibit autocorrelation within individual shoes, meaning a run of busts increases the likelihood of additional busts until the deck is reshuffled. Yet the magnitude of these effects remains modest, and edge calculations require precise accounting for all rule parameters including double-down restrictions and surrender options.
Log keepers typically apply filters to distinguish meaningful clusters from noise, discarding entries where sample sizes fall below 50 hands per table. This discipline aligns with recommendations from gaming analysts who emphasize that variance spikes lose predictive value when observed in isolation. In July 2026, several North American casino groups expanded their use of automated table tracking systems, supplying aggregated bust data that independent researchers now compare against individual player logs for validation purposes.
Integration with Bankroll Management
Successful alignment of larger wagers with dealer bust clusters demands strict separation between observation phases and betting phases. Participants record minimum-bet rounds to establish the pattern, then escalate only after predefined thresholds appear in the data. External reports from the Australian Institute of Criminology highlight that disciplined record-keeping correlates with steadier session results across skill-based table games, although overall house advantages persist regardless of timing adjustments.
Some logs incorporate heat maps that visualize bust frequency by dealer position and table location, revealing whether certain physical environments produce more pronounced variance. These visual aids help players decide when to remain at one table versus moving to another where fresh data collection can begin. The method does not alter the underlying probabilities but organizes existing information into actionable sequences for those who invest time in maintaining the records.
Conclusion
Streak-mapping logs represent one systematic approach to organizing blackjack outcome data around dealer bust patterns, grounded in observable statistical properties of finite decks. The practice combines detailed notation wth selective wager escalation, always within the constraints of fixed game mathematics. Regulatory data and academic examinations continue to supply context for how such personal tracking fits alongside broader industry performance metrics.